Battery Management System
NMCAD Labs, IISC- Dr. Dineshkumar Harursampath
Battery management systems are a vital part of any electrical system, and the driving force behind an efficient power delivery system is the battery management system. The battery management system or BMS in short, protects and monitors the battery, by keeping the battery conditions and parameters within design limits. It does so by measuring vital parameters and conditions like the cell voltage, the state of charge, state of health, charging and discharging rates, pack and cell temperatures etc. This often involves complex electronics and mathematical modelling, one such approach to overcome these is to use modern estimation techniques which reduce microprocessors, sensors, wiring, execution times etc. The project was undertaken to assist the avionics team in building one of the estimators for their Battery Management System. The model predicts cell voltages based on amount of energy, charge supplied to the cell during charge in watt-hours, the amount of energy, charge extracted from the cell during discharge in watt-hours and it's temperature of operation. With an excellent 98.2% accuracy on about 21k new input values, the model holds promising applications and usage.
Cell Voltage Estimation
Approach and Dataset
- The dataset was collected from the Carnegie Mellon University archive and was carefully gone through and observed to make notes of the properties of data.
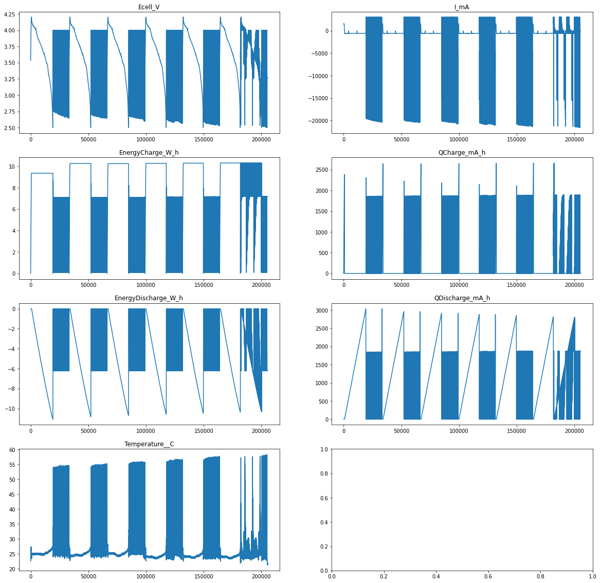
- After plotting the data on graphs and using various attributes and functions from the pandas library, some insights were drawn for the dataset; them being -
- That dataset had both signed as well as unsigned values.
- The range of values within a parameter varied across a range of about 40000 units.
- The range of values across parameters also greatly varied, with values ranging from single digits to 10s of thousands.
- There were just 2 data types involved, integer and floating point.
- The dataset was complete with no missing values and the source of dataset vouched for its correctness and absence of outliers.

Model and Data Decisions

After a detailed analysis and understanding of the data, the model selected for the task was Support Vector Regression (SVR). This decision was based on SVR's superior fit over linear regression for multi-dimensional data, its flexibility in terms of kernels, degrees, regularization parameter, and gamma which significantly aids in hyperparameter tuning, and its excellent generalization capability that enhances prediction accuracy, especially with large datasets. Given these properties, specific and general preprocessing steps were identified to optimize the model's performance. Support vector machines require that all data be in the same value range, leading to the normalization of data. Data was scaled between the maximum and minimum parameters to accommodate signed values. Additionally, the dataset was shuffled to minimize generalization, an optimization decision made post initial training that improved model accuracy by about 4.1% from the initial run.
Pre Processing and Data Preparation
The dataset had a few redundant parameters as well which played little to no incremental role in model prediction but significantly increased the complexity of input and greatly increased run times, this along with other decisions made in the previous stage were made note of
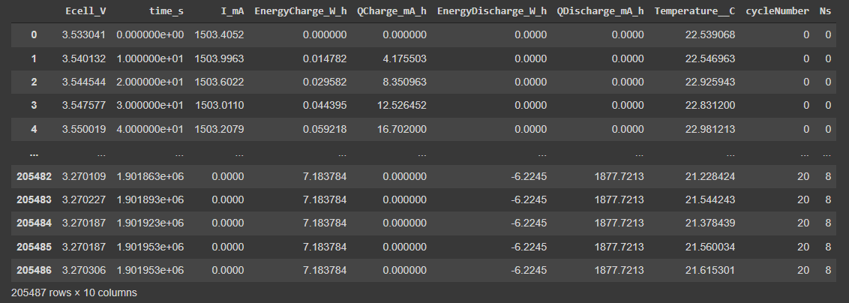
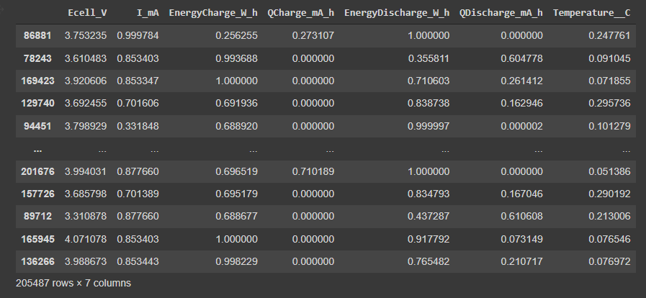
After all the pre processing steps, namely, column drop, min-max scaling and shuffling, this was the dataset which was achieved. Post pre processing, the data set was split into 2 parts, the train and test split. 85% of the data was put for training and 15% of the data was kept for testing the model. This meant that, 20549 data points were allotted for testing and 184938 data points were allocated for training the model.
Model Training and Inferences
- Several runs of Grid Search were conducted to determine the most appropriate model parameters.
- Grid search runs helped identify patterns in inference accuracies, prompting further theoretical studies and data analysis.
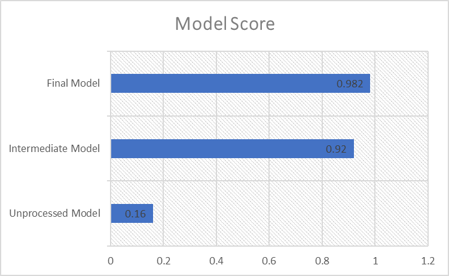
- The final hyperparameters selected were C=5, degree=5, kernel='poly', achieving a prediction accuracy of approximately 98.2%.
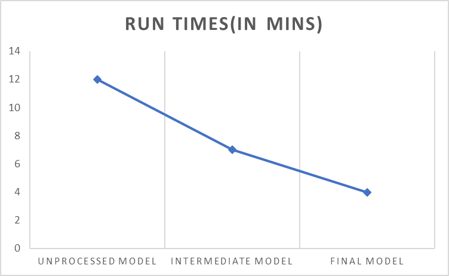
- These settings reduced run times by about 33% and increased model accuracy by an additional 2.1% from previous runs.
- The model was saved as a pickle file for future inferences and use with simulation and computing software like SIMULINK and MATLAB.
- A comparison of the various model stages was conducted to evaluate performance improvements.
Optimum Airfoil Search

Airfoils are the most distinguishable feature of any flight vehicle and one of the most crucial ones too. They play a vital role in determining the lift and drag generated by a airfoil. It affects the key performance parameters of the entire aircraft like stability, lift etc. Just like any other feature of the aircraft, aircrafts have determining and driving characteristics too, such as, operation speeds, class of purpose, lift requirements etc. With the vast variety of airfoils available, it is hard to short list and decide upon an airfoil in a short amount of time. The project aims to solve this by creating a query on a database of airfoils with key dimensional and performance data like chord lengths, thickness, cl/cd ratios, corresponding alpha for the cl/cd ratio. The data was scraped from www.airfoiltools.com to build the database.
Obtaining dataset
Data was sourced from www.airfoiltools.com. The Approach and the entire process was broken down into smaller and simpler steps to ease out the entire process and make debugging and tracking of data easier. The steps were - Creating a list of URLs and names of all airfoils and airfoildata: This was achieved by using list operations and studying the patterns in the URLs. The result was a list of urls and names of 1638 airfoils and 6552 data point URLs built for the Reynold’s numbers 50000, 100000, 200000, 1000000 The structural data of the airfoil was not available as a file, hence it was extracted from the airfoils ’s homepage using html parsing. The functions were defined for vital and repetitive tasks. Post which, all the files were downloaded onto a google drive and required data was extracted with a series of python functions and operations and appended to a different file. The final database file with the following key ['name', "reynold's number", 'Ncrit', 'Mach Number', 'cl/cd', 'angle at max cl/cd', 'max thickness', 'max thickness at', 'max camber', 'max camber at'] was then exported and prepared to be used by the SQL queries and python front end.
Loading data into the MySql schema
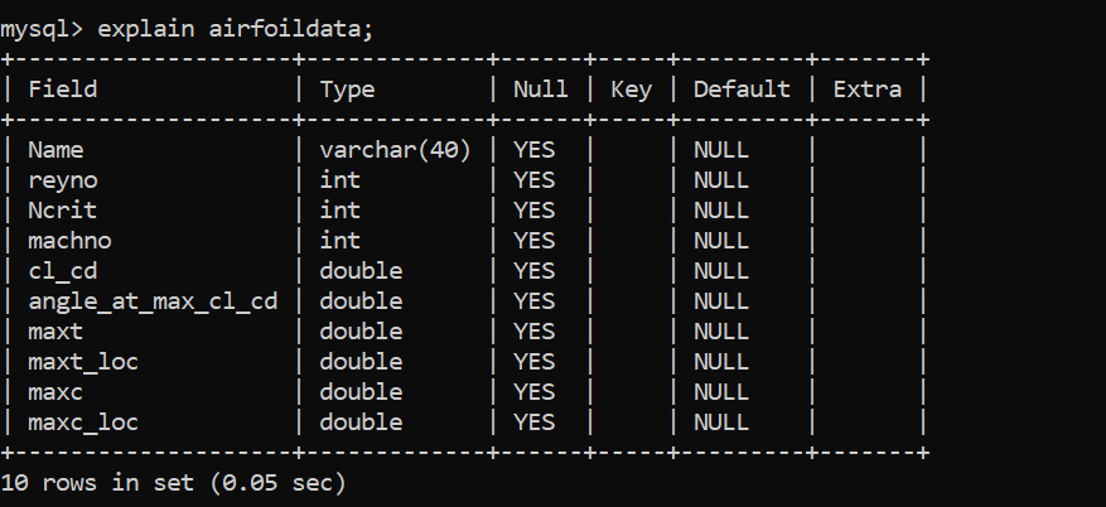
Once the dataset was obtained, a thorough scan of the dataset at hand was performed to determine the prominent attributes that must be taken into consideration before preparing our SQL database. The parameters that were taken into consideration are: Name, Reynold’s Number, Cl/Cd Ratio, Angle of attack at maximum Cl/Cd Ratio, Maximum Thickness, Location of maximum thickness, Maximum Camber and Location of maximum Camber. Only airfoils with a constant Ncrit value of 9 and constant Mach No. of 0 are being considered. Then an appropriate RDBMS schema was created and the csv file was loaded into the SQL database. The schema for this table is shown in the image below.
Designing the front end UI
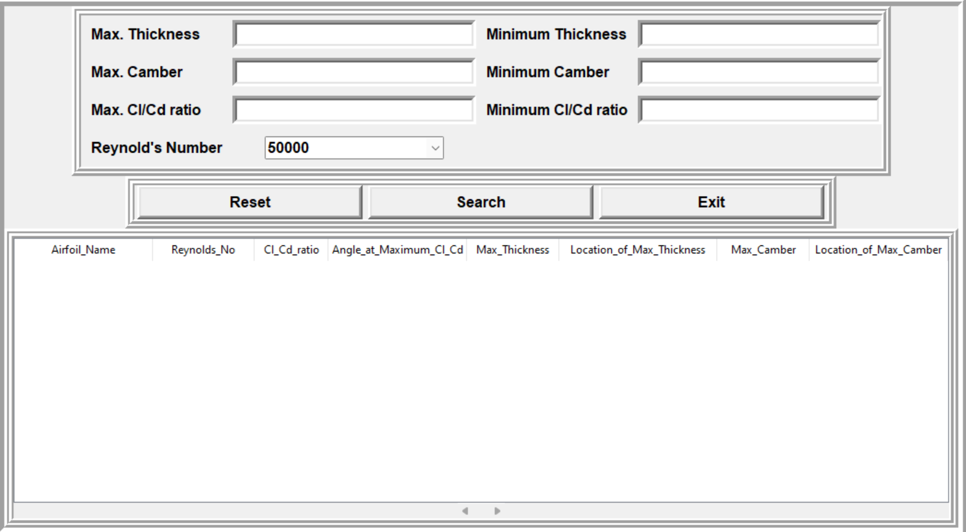
Once the dataset is loaded into the Relational database, the front end was designed to allow the users to perform search queries with ease. Python Tkinter Treeview is used to design and implement the UI as it provides a tabular representation of the data and it has all the properties of the table. The UI is built in a way that based on the parameters entered by the user we must be able to appropriately search for the most suitable airfoil(s) and return the list to the user. All parameters are made optional to the user in order to enforce greater flexibility in the query process. The front end UI is as shown below.
Integrating frontend and backend
Once the frontend was designed, we design the MySql query that will be most suitable to obtain the results of our choice. In places where the use does not enter a value, default values have been considered that will cover the entire dataset. We then connect the front end to the backend by using pymysql which is a connector that is used to successfully integrate python frontend to MySql backend. PyMySql works by establishing a connection between the Python UI and MySql. Then the values entered by the user are extracted from the form and is appended to the query which is then executed on the database to obtain the desirable set of rows. These rows are then sent back to the frontend and displayed on the users screen.

Executing queries and obtaining results
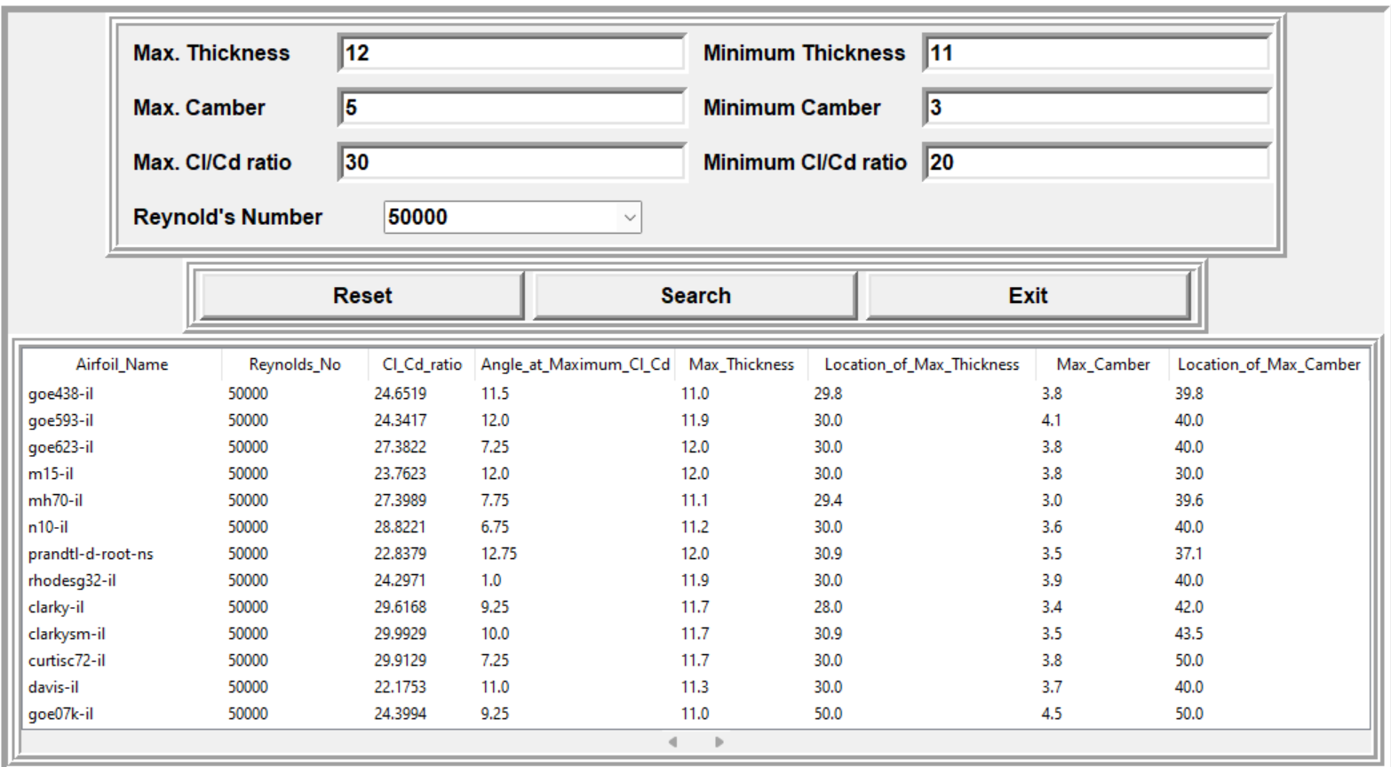
Once the connection between the front and backend is successfully established we run our query to obtain results as required.