ISRO RESEARCH ASSISTANT
Deep Learning Model for Satellite Image Classification - Dr. Ramachandra Hebbar
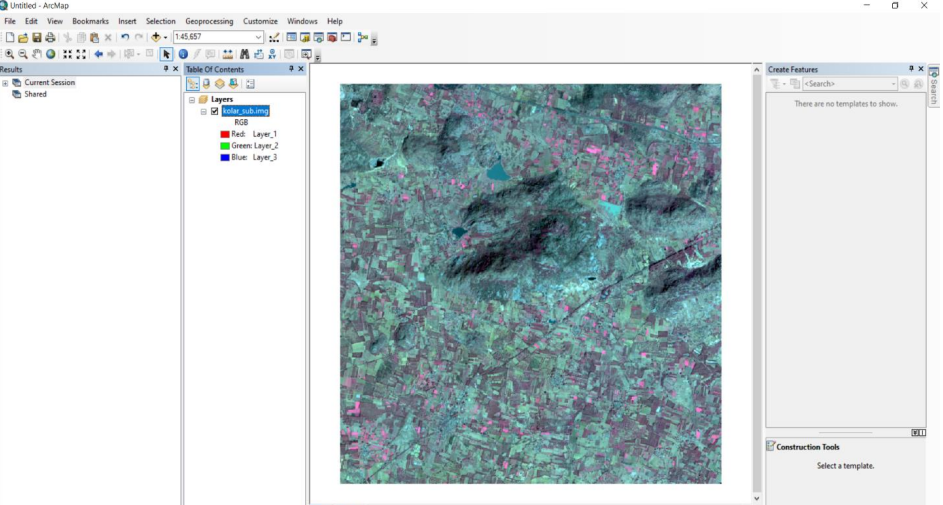
Remote sensing has always been an interesting field of study. Computer vision and artificial intelligence has been clubbed with remote sensing to semi-automatically analyze the change in land use patterns. This has significantly helped in reducing the survey time as well as the cost. The ease of implementation of Deep Learning algorithms has further increased the scope for remote sensing. Satellite images are of great importance for the various organization for mapping various natural resources and for analyzing land usage patterns, urban growth, forest change, and infrastructural development. In this project, we identify and classify Mango, Eucalyptus, and Coconut plantations using the 8bit and 16bit data multispectral satellite images. High-resolution WorldView-2 data comprising 8 bands covering parts of Kolar, India has been used for the study. The images are pre-processed, labeled, and segmented using deep learning algorithms, and a graphical user interface is developed which outputs the area occupied by each class. The comparison of the results is discussed after using the Semantic segmentation- U-Net architecture on both 8bit and 16bit datasets. The python packages used for pre-processing are Open Computer Vision (OpenCV) and Geospatial Data Abstraction Library (GDAL). The images were labeled using ARGIS and ERDAS. In the present study, the overall accuracy of both models was obtained.

Objectives
- Develop a U-NET based model for satellite image classification.
- Compare classification results between 8-bit and 16-bit data.
- Achieve high classification accuracy using deep learning techniques.
- Analyze vegetation spread in the Kolar region.

Methodology
Data Collection
The satellite images obtained are 8 band, 16-bit images. However, labelling of images would require the digital visualization of images in any of the standard colour spaces. Hence the image is converted into 8-bit RGB image using normalization techniques to ensure effective visualization. The contrast of the image is further removed using CLAHE based normalization. Any machine learning technique would require annotating the images. Semantic segmentation used requires creation of masks depicting various classes. ARCGIS PRO based semantic segmentation annotation tool is used to effectively label the images.


Model Development
We have implemented the Classification of Vegetation using the TensorFlow library. Dataset for each of 8-bit and 16-bit data contains around 950 images and masks corresponding to each of the images. The input dataset is cut into 256 x 256 images and is annotated as explained above and taken for preprocessing.The Proposed architecture is a U-Net Architecture with input shape of image taken as 256 x 256. Both the encoder and decoder blocks consist of 4 Convolutional blocks with each block contain a set of Conv2D layers, Batch Normalization Layer and having Rectified Linear Unit as Activation function.
Training and Evaluation
The model was trained using 70% of the dataset and tested on the remaining 30%. Various performance metrics were used to evaluate the accuracy and efficiency of the model, such as precision, recall, and F1-score. For Model Optimization, Optimizer is chosen as Adam since it performs best in most of the scenarios. Hyperparameters like Learning rate is set by hit and trial method. Since the purpose is multi-class classification, Loss Function is taken as Sparse Categorical Cross-entropy and Intersection Over Union is taken as metrics for evaluation.

Results
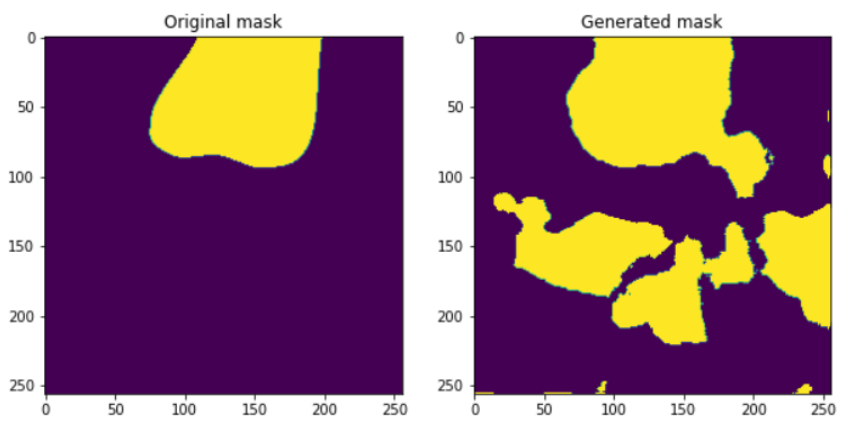
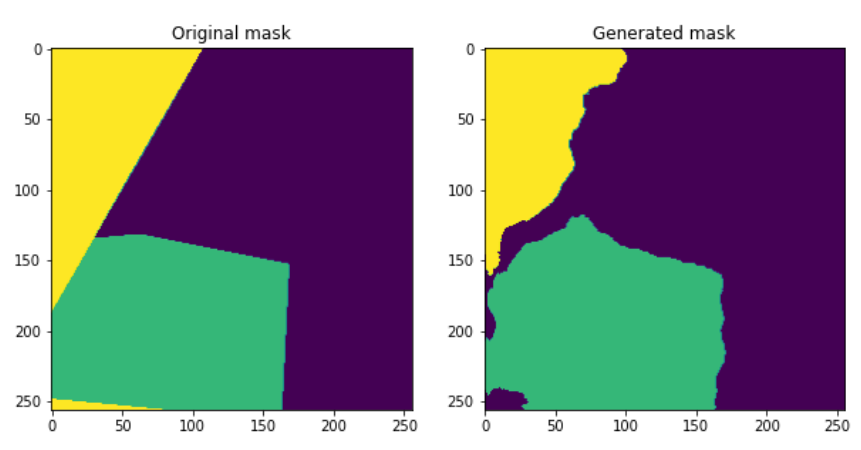
The aim of this study was to use U-net architecture on the 16-bit multispectral data to classify the coconut, mango and eucalyptus plantations. The result is compared with the 8-bit multispectral data with the same crop plantations. The area under consideration was Kolar, India. It is found that the validation accuracy of both the type of datasets were nearly similar proving to us that 16-bit data could be used for further research.


